Chart patterns are recurring price formations on a trading chart, used in technical analysis to judge whether a trend is likely to continue or reverse. A pattern is bounded by at least two trendlines, appears on any charting period from one minute to one week, and — critically — is not complete until an actual breakout occurs. This guide covers the 12 formations that recur most consistently across forex, indices, commodities and equities, with the identification rules and the measured-move target for each.
Key Takeaways
- A chart pattern is bounded by at least two trendlines and is only complete once price breaks out — an unbroken pattern is not a signal.
- Patterns fall into three families: continuation (flags, pennants, wedges), reversal (head and shoulders, double and triple tops) and bilateral (symmetrical triangles, rectangles), which can resolve either way.
- Every pattern has a measured move — a target derived from the pattern’s own height, projected from the breakout price.
- Volume confirmation separates genuine breakouts from false ones. Volume typically contracts as a pattern forms and expands sharply on a valid breakout.
- Patterns are fractal and appear on every timeframe, but a daily or weekly bar summarises a full session of participation, so higher-timeframe patterns carry more information than intraday ones.
- Distinguish a false breakout (price returns through the breakout level) from a failed breakout (price then breaks out the opposite way). The second is what damages accounts.
- Risk control comes first: a defined maximum risk per trade, and a stop placed outside the pattern boundary rather than inside it.
Understanding Chart Patterns in Modern Markets
Chart patterns represent one of the most powerful analytical tools available to traders and investors across global financial markets. These visual formations, created by price action on trading charts, offer systematic approaches to understanding market behaviour and anticipating future price movements. Whether you’re analysing equities on the Toronto Stock Exchange, forex pairs, or cryptocurrency markets, mastering pattern recognition can significantly enhance your trading decisions.
According to research by Thomas Bulkowski, certain chart patterns demonstrate success rates exceeding 70%, making them invaluable additions to any trading strategy. At VT Markets, we’ve observed that traders who properly identify and trade these patterns consistently outperform those relying solely on fundamental analysis or gut instinct.
What Are Chart Patterns?
Chart patterns are visual formations that appear on price charts when an asset’s price moves within specific boundaries before breaking out in a defined direction. These formations emerge during consolidation phases — periods when buyers and sellers reach a temporary equilibrium before the market resumes its trend or reverses course.
At their core, chart patterns form as price repeatedly tests key support and resistance levels, creating recognisable geometric shapes such as triangles, rectangles, wedges, and curved formations. These are fundamental tools in technical analysis and price action trading, helping traders identify high-probability entry and exit points based on historical price behaviour.
Chart patterns can be observed on any asset class — equities, forex currency pairs, cryptocurrencies, and commodities — and across all timeframes. A symmetrical triangle on a daily EUR/USD chart follows the same principles as one on a Bitcoin or S&P 500 chart, demonstrating the universal nature of market psychology across global financial markets.
Unlike fundamental analysis, which evaluates economic data and financial statements, chart pattern analysis focuses purely on price action and market structure, making it accessible and applicable regardless of the underlying asset.
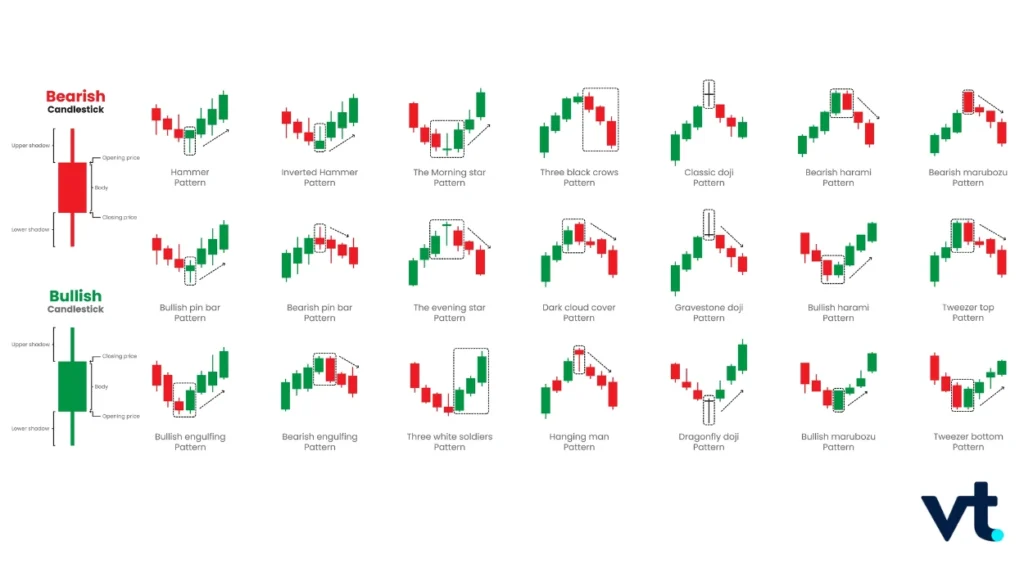
Chart Patterns Across Different Markets
Patterns recur across asset classes because they reflect trader behaviour rather than any property of the instrument. The same formations appear in equities, forex majors, gold and cryptocurrencies — with one adjustment: higher-volatility markets produce more exaggerated moves in both directions, so the same pattern needs wider stops and delivers wider targets.
The Psychology Behind Chart Patterns
Chart patterns are a map of collective indecision resolving into agreement. In a head and shoulders top, the left shoulder is confident buying; the head is the last push by buyers who are already thinning; the right shoulder is a failure to reach that high again. The neckline break is the moment the market concedes.
Reversals at market tops are distribution patterns — the instrument is being sold more enthusiastically than bought. Reversals at bottoms are accumulation patterns. Two rules follow, and they hold across every pattern in this guide: the longer a pattern takes to form, and the larger the price movement contained within it, the more significant the move once price breaks out.
The reason patterns repeat consistently across different markets and timeframes is that human psychology remains constant. Fear, greed, hope, and panic drive market participants to react predictably when facing similar circumstances.
Types of Chart Patterns
| Family | Signal | Examples | Volume on breakout |
|---|---|---|---|
| Continuation | Trend resumes after a pause | Flags, pennants, wedges, cup and handle | Increases sharply |
| Reversal | Trend changes direction | Head and shoulders, double and triple tops/bottoms | Strong confirmation required |
| Bilateral | Breakout likely, direction unknown | Symmetrical triangle, rectangle | Direction confirmed by the breakout itself |
Continuation Patterns
A continuation pattern is a temporary interruption of an existing trend — the bulls catching their breath in an uptrend, or the bears pausing in a downtrend. While the pattern is forming there is no way to know whether the trend will continue or reverse, which is why technical analysts assume continuation until a reversal is confirmed.
Reversal Patterns
A reversal pattern signals that the prevailing trend is exhausting. The established trend pauses, then moves in a new direction as pressure builds from the opposite side. Reversal patterns are only complete on a break of the pattern’s defining level — the neckline, the middle reversal point, or the intermittent trough.
Bilateral Patterns
A bilateral pattern signals that a breakout is likely without indicating direction. A symmetrical triangle is the clearest example: two trendlines converge, price compresses, and the breakout resolves the question. Bilateral patterns demand that you plan both directions before entering.
Essential Chart Patterns Every Trader Should Know
1. Head and Shoulders — Bearish Reversal
A head and shoulders top is a bearish reversal pattern made of three peaks: a left shoulder, a higher centre peak (the head), and a right shoulder at approximately the left shoulder’s level. The line joining the two troughs between the peaks is the neckline. The pattern is only complete when price breaks the neckline.
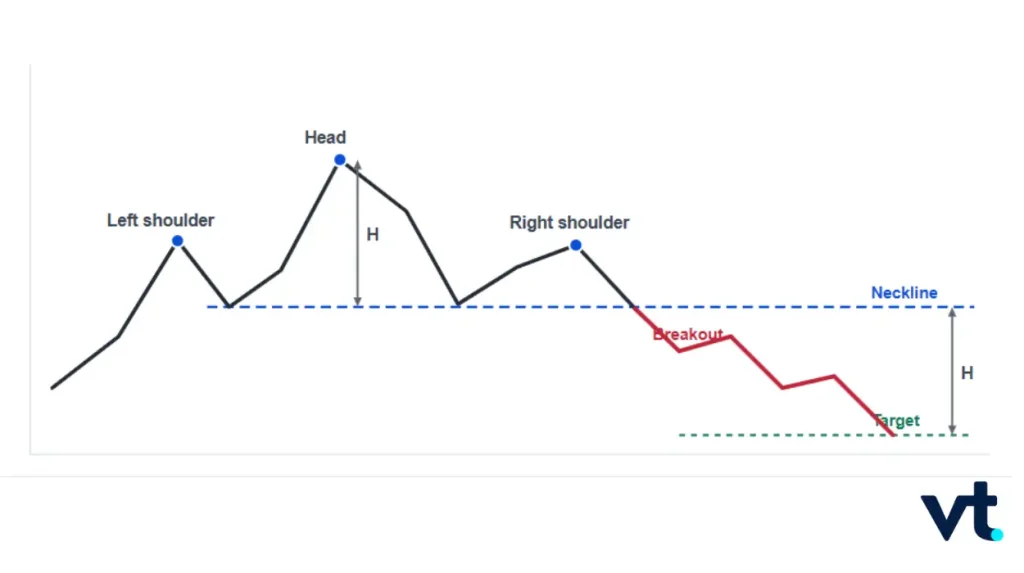
How to identify it
- Three peaks, with the centre peak clearly higher than the two shoulders.
- Shoulders at approximately the same level as each other.
- A neckline connecting the two intervening troughs — horizontal or slightly sloped.
- Volume often declines as the pattern develops, then expands on the neckline break.
Measured move
Measure the vertical distance from the head to the neckline, then project that distance from the neckline in the breakout direction.
Kirkpatrick and Dahlquist describe the head and shoulders top as the standard pattern for tops, with one of the lowest failure rates among reversal formations — which is why it is treated as a benchmark. It is not a guarantee.
2. Inverse Head and Shoulders — Bullish Reversal
An inverse head and shoulders is the mirror image, forming at market bottoms and signalling a bullish reversal. The geometry, neckline rule and measured move are identical, inverted. Note that the bottom pattern is generally less profitable than the top version.
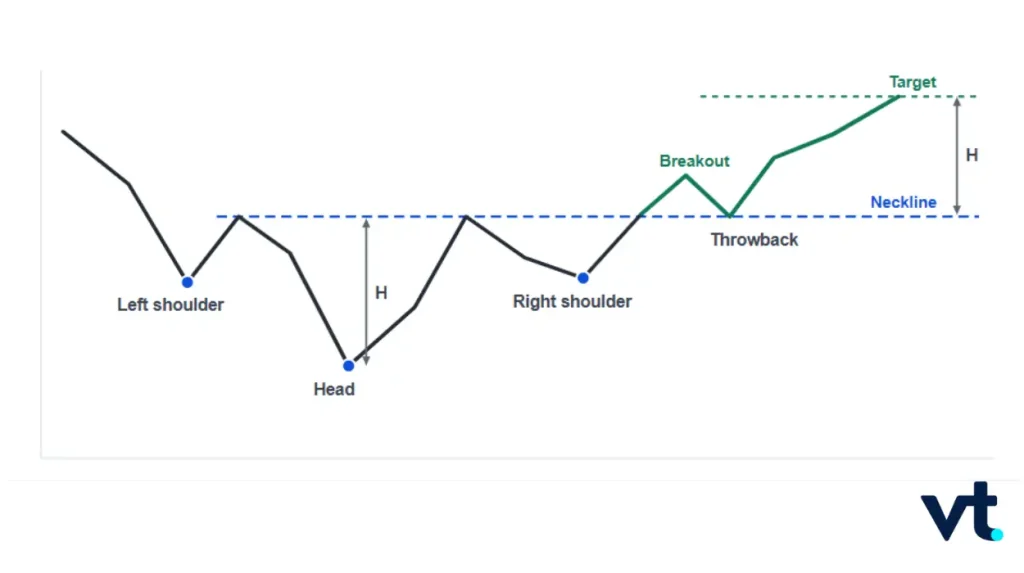
3. Double Top and Double Bottom — Reversal
A double top is two successive peaks at roughly the same price, separated by an opposite reversal point. It signals a bearish reversal when price breaks below that middle reversal point. A double bottom is the inverse: two troughs at roughly the same price, separated by a peak, confirming bullish reversal on a break above that peak.
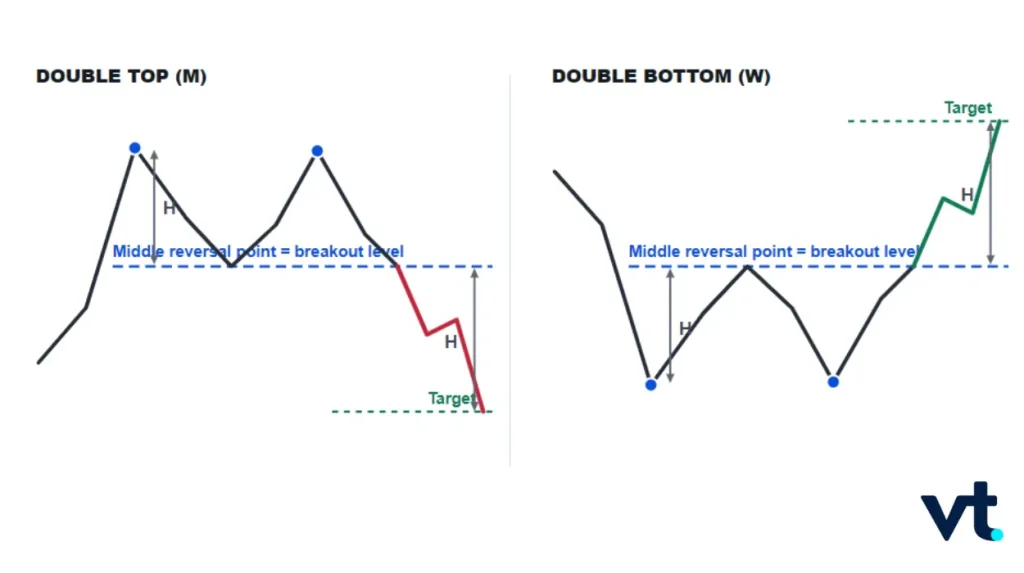
How to identify it
- Two peaks or troughs at roughly the same price — the shared level is the support or resistance being tested.
- Peaks may be rounded or pointed; both are valid.
- Price must break out through the middle reversal point. This is the rule most often ignored.
- Volume typically decreases on the second peak or trough, indicating weakening conviction.
Measured move
For a double top, take the height from the highest peak to the intervening trough and subtract it from the breakout price. For a double bottom, take the distance from the troughs to the intervening peak and add it to the breakout price.
4. Triple Top and Triple Bottom — Reversal
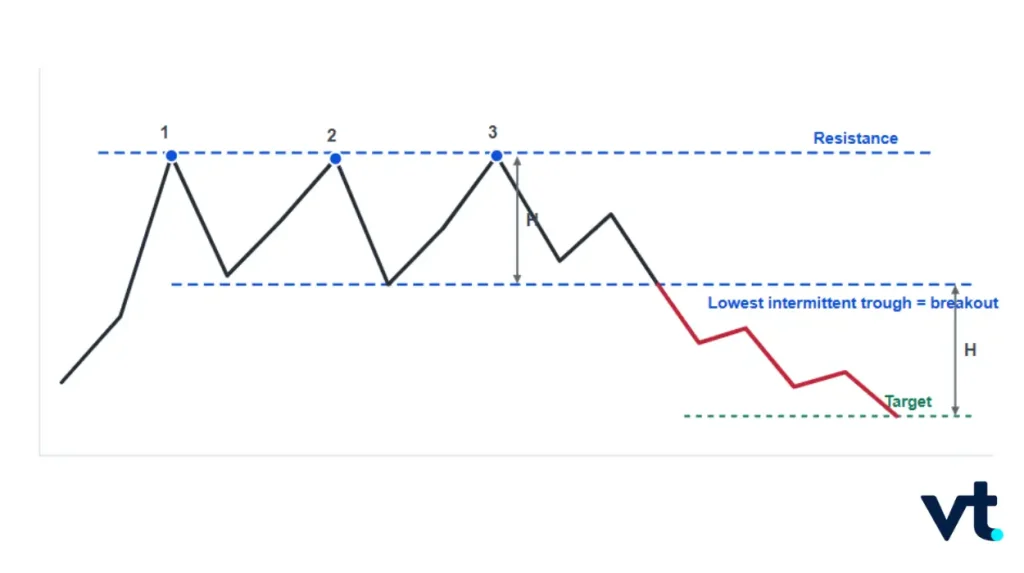
A triple top is three distinct peaks at roughly the same price level, separated by two intermittent troughs. It is less common than a double top or head and shoulders but behaves similarly, and three failed attempts at one level is a stronger statement of exhaustion than two.
5. Ascending Triangle — Bullish Bias
An ascending triangle is bounded by a horizontal upper trendline and a rising lower trendline. Buyers step in higher at each pullback while sellers hold one fixed level — a compression that usually, though not always, resolves upward.
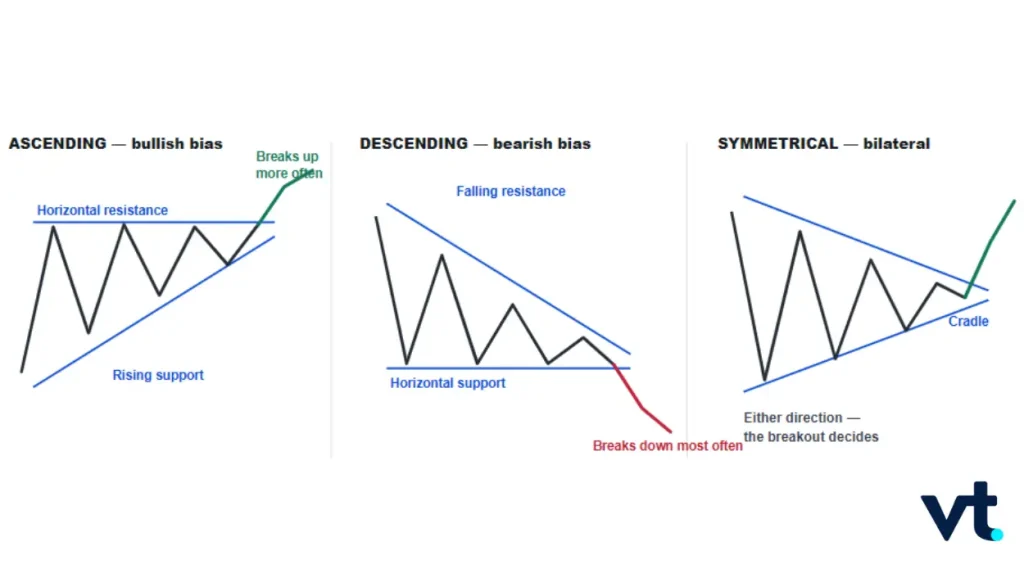
- Price can break in either direction, but more commonly upward.
- Breakout usually occurs within the pattern rather than at the apex.
- About average failure rates, but expect many small false breakouts.
- Post-breakout performance is average on the upside and above average on the downside — a downside break from an ascending triangle is worth respecting precisely because it is the unexpected outcome.
6. Descending Triangle — Bearish Bias
A descending triangle is bounded by a horizontal lower trendline and a downward-sloping upper trendline. Each rally is capped lower while one support level holds, indicating decreasing demand. Price can break either way but most commonly breaks downward, with above-average performance on the less common upside break. Retracements after the breakout occur often.
7. Symmetrical Triangle — Bilateral
A symmetrical triangle is bounded by a downward-sloping upper trendline and an upward-sloping lower trendline, both straight. It signals that a breakout is likely without indicating direction. Price must touch each boundary at least twice for the pattern to be valid, and the converging apex region is known as the cradle.
Measured move
Take the height from the highest peak to the lowest trough in the pattern, then add it to the breakout price for an upward break or subtract it for a downward break. An alternative widely used convention projects the height of the triangle’s left vertical side.
Expect many false breakouts and moderate performance overall. The upward break is the better of the two, and is above average across all patterns.
8. Rising and Falling Wedges
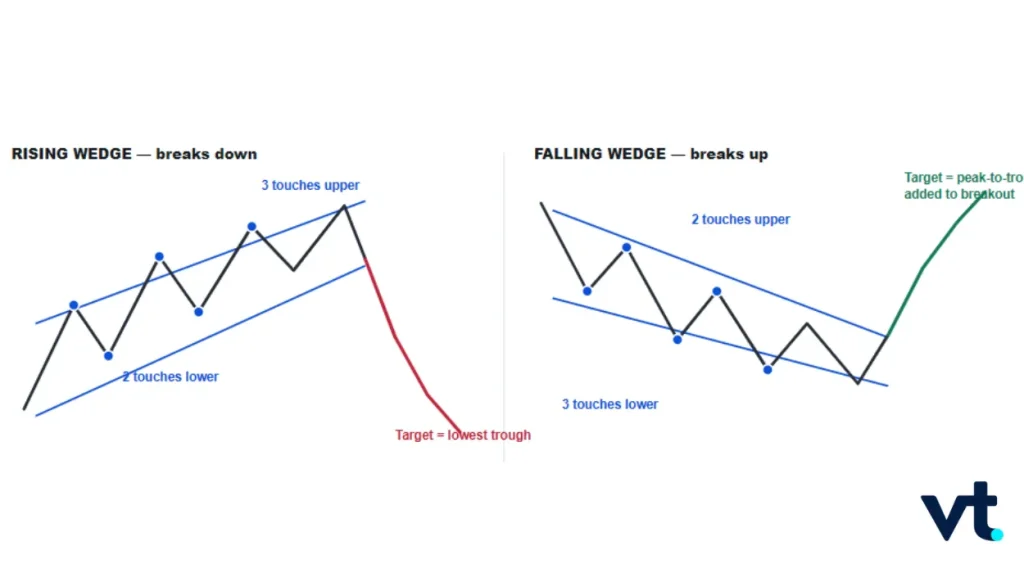
A wedge is bounded by two trendlines heading in the same direction — both up, or both down. This is what separates a wedge from a triangle, whose boundaries converge from opposite directions. A falling wedge often follows a panic; a rising wedge often follows a bubble.
Measured move
For a downward breakout, the lowest trough in the pattern is the target. For an upward breakout, take the height from the highest peak to the lowest trough and add it to the breakout price.
Trade wedges smaller, not larger. Performance in both wedge types is below average, and retracements after the breakout are very common.
9. Rectangles
A rectangle is a trading range bounded by horizontal support and resistance, often with a slight tilt. It is the simplest pattern to see and one of the hardest to trade, because it produces many false breakouts.
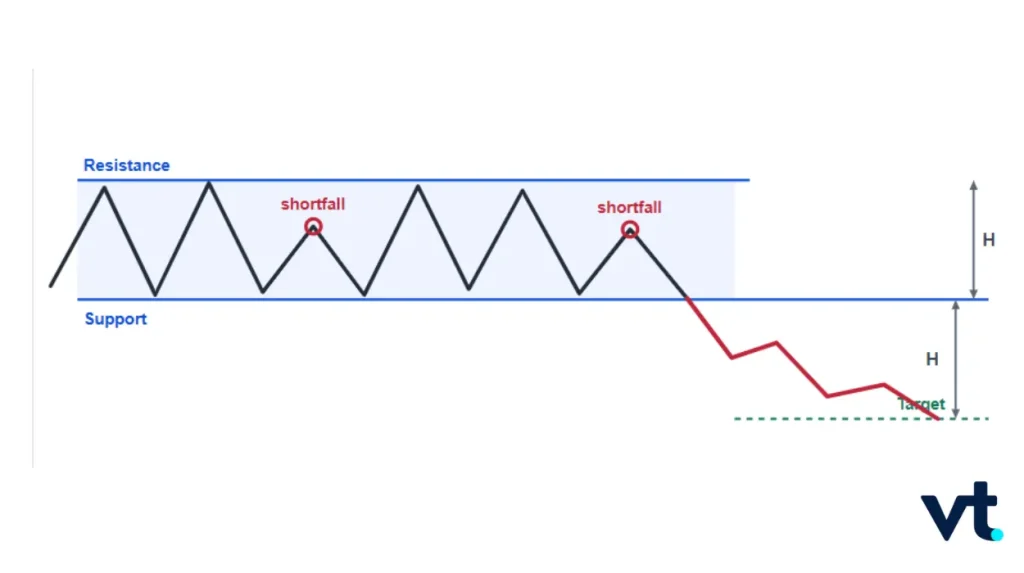
One detail is worth more than the pattern itself: a shortfall — a failure of price to reach one boundary before turning — often indicates the eventual breakout direction. If price stops short of resistance repeatedly, the eventual break is more likely to be downward. The best occurrence is a rectangle at a market bottom breaking upward.
Measured move
Take the height from resistance to support. Add it to resistance for an upside target, or subtract it from support for a downside target.
10. Flags and Pennants — Short-Term Continuation
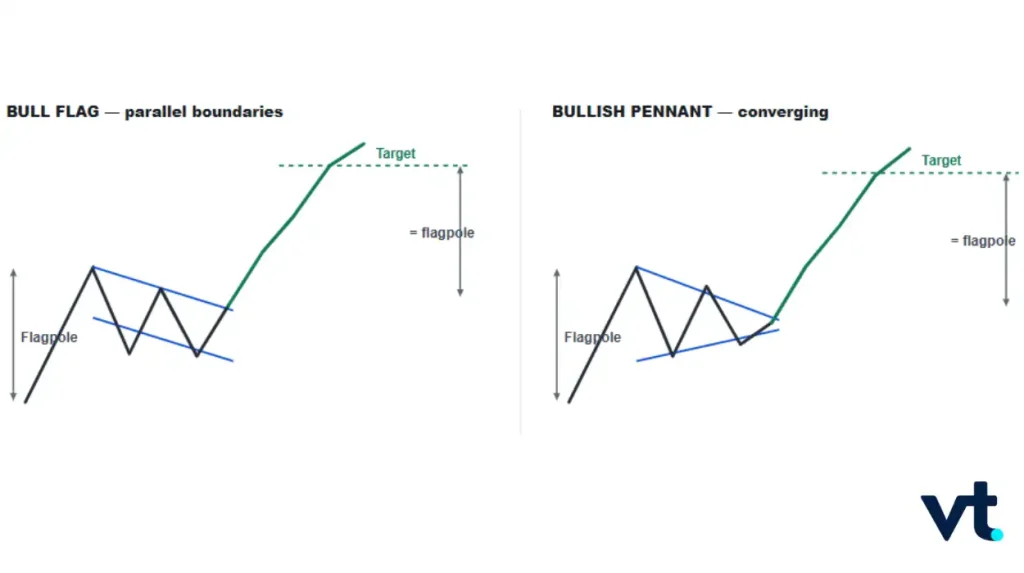
Flags and pennants are variations of the same pattern: a short consolidation following a steep, sharp price move known as the flagpole. A flag is drawn with two parallel trendlines; a pennant is drawn with two converging trendlines. Both generally slope slightly against the prevailing trend.
Measured move
The breakout is often followed by a move that equals the sharp price change that preceded the pattern. Take the height from the start of the flagpole to the highest peak in the pennant, and add it to the bottom of the pennant.
11. Cup and Handle — Bullish Continuation
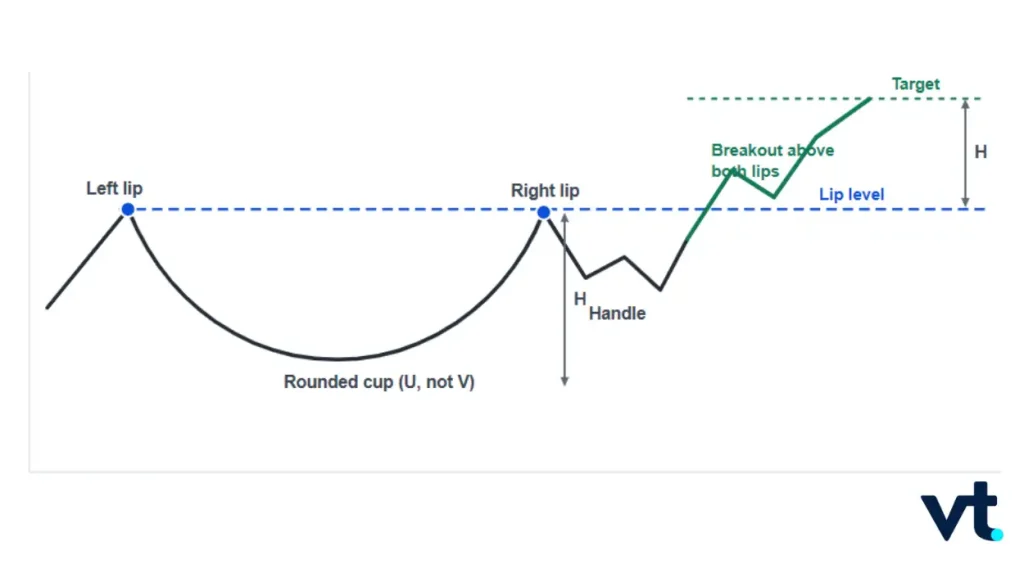
A cup and handle, also called a saucer, is a bullish continuation pattern popularised by William J. O’Neil. It consists of a rounded bottom — a U shape, not a V — with a lip at each end, followed by a short pullback on the right that resembles a flag: the handle.
How to identify it
- A rounded bottom. A V-shaped recovery is a different formation.
- Two lips at roughly comparable levels, though exact symmetry is not required.
- A handle forming as a brief pullback from the right lip.
- The pattern is complete only on a breakout above both lips.
- A throwback to the breakout level is common afterwards.
Performance ranks about average for bottom patterns. The pattern’s reputation for high reliability comes from studies applying strict formation criteria; loosely identified cups perform considerably worse.
12. Gaps — Breakaway, Runaway and Exhaustion
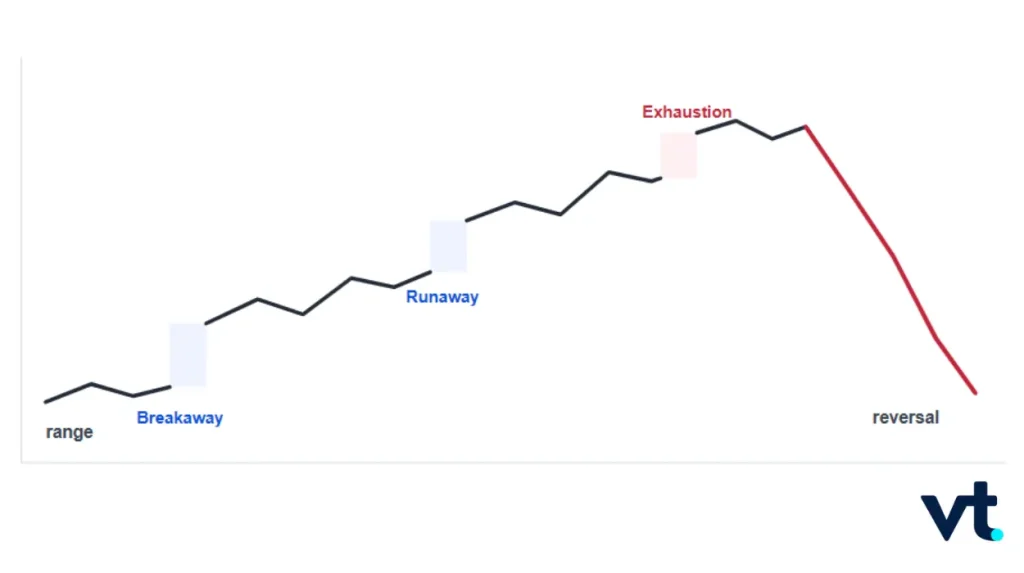
A gap is a price range in which no trading occurred, created when a market opens away from its previous close. A stock closing at $5.00 and opening at $7.00 after earnings has gapped $2.00. Where the gap sits within a trend determines what it means.
| Gap type | Position in trend | Interpretation |
|---|---|---|
| Breakaway | Start | A new trend beginning, often out of a pattern or a support/resistance level |
| Runaway (measuring) | Middle | The existing trend accelerating |
| Exhaustion | End | A final surge as the trend runs out; often precedes reversal |
Gaps are generally profitable on breakouts from patterns, trends, or support and resistance — which makes them a confirmation tool as much as a pattern in their own right.
Measured-Move Cheat Sheet: The Target Formula for Every Pattern
Every pattern in this guide produces a price target from its own dimensions. This is the complete set in one place.
| Pattern | Measure this | Then |
|---|---|---|
| Head and shoulders (top or bottom) | Head to neckline | Project from the neckline in the breakout direction |
| Double top | Highest peak to intervening trough | Subtract from the breakout price |
| Double bottom | Troughs to intervening peak | Add to the breakout price |
| Triple top | Highest peak to lowest trough | Subtract from the lowest trough in the pattern |
| Symmetrical triangle | Highest peak to lowest trough | Add for an upside break, subtract for a downside break |
| Ascending / descending triangle | Highest peak to lowest trough | Add for an upside break, subtract for a downside break |
| Wedge — downward break | — | The lowest trough in the pattern is the target |
| Wedge — upward break | Highest peak to lowest trough | Add to the breakout price |
| Rectangle | Resistance to support | Add to resistance, or subtract from support |
| Flag / pennant | Flagpole start to the pennant’s highest peak | Add to the bottom of the pennant |
| Cup and handle | Right cup lip to cup bottom | Add to the breakout price |
Measured moves are geometric projections, not forecasts. A projected target may never be reached, and one warning from the primary literature is worth repeating: do not hold an original price target after the conditions that produced it have changed.
How to Identify Chart Patterns
Drawing Trendlines and Support/Resistance
A trendline connects a series of descending peaks or ascending troughs, marking where support or resistance has held. Accurate drawing is what separates a genuine pattern from a shape you have imposed on noise.
- Three points beat two. A trendline with three or more touch points is considered more valid than one drawn from two.
- Use the candle body, not the wick. The body spans open to close and excludes the thin wicks, so it usually gives a more representative touch point. Many chartists use closing prices on longer-term charts.
- Up trendlines connect ascending lows and mark support below price; down trendlines connect descending highs and mark resistance above.
- Consolidation is price oscillating between two parallel, often horizontal, trendlines.
- Horizontal support and resistance at previous significant highs, lows and round numbers often proves more durable than an angled trendline.
Volume Analysis
Volume is the primary filter for pattern validity. The standard sequence is contraction then expansion: volume tapers off as the pattern forms and uncertainty builds, then surges when price breaks out and the market commits. A breakout on flat or falling volume is the classic profile of a false breakout.
False Breakouts, Failed Breakouts and Confirmation Filters
These two are routinely confused, and the distinction is worth money.ume (OBV) and volume moving averages, provide additional confirmation tools beyond simple volume analysis.
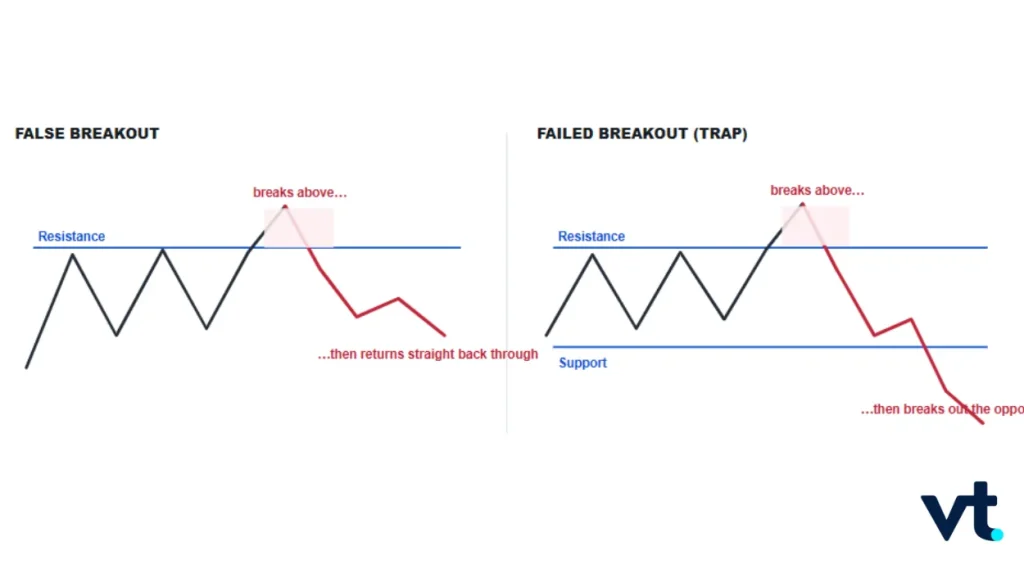
- A false breakout occurs when price breaks out and then almost immediately returns back through the breakout price.
- A failed breakout, or trap, occurs when a false breakout happens and price then breaks out in the opposite direction.
A confirmation filter is a test applied before accepting a breakout. Five types are in common use:
- Intrabar — price must exceed the level by a set amount during the bar.
- Multiple closes — two or more consecutive closes beyond the level.
- Time — the level must hold for a set number of bars.
- Percentage or point — the breakout must exceed the level by a fixed percentage or point value.
- Money — the move must exceed a fixed currency amount.
Pick one filter, define it numerically, apply it consistently. Filters trade a slightly worse entry price for a materially lower false-signal rate. An inconsistently applied filter is no filter at all.
Throwbacks and Pullbacks After a Breakout
After a valid breakout, price often retraces toward the breakout level before resuming. The direction determines the name: a throwback follows an upward breakout, a pullback follows a downward breakout. Two practical notes: they do not always occur, so waiting for one means missing trades; and performance can suffer when they do occur, so a retracement is not a free second entry.
Which Timeframe Is Best for Chart Patterns?
Patterns are fractal and form on every timeframe, but they do not carry equal information. A daily bar summarises a full session of participation; a five-minute bar summarises noise.
| Timeframe | Relative reliability | Best use |
|---|---|---|
| Weekly | Highest | Major trend identification, position trading |
| Daily | High | Swing trading; the most reliable pattern formations |
| 4-hour | Moderate | Short-term swing entries, flags and pennants |
| 1-hour | Lower | Intraday entries; requires tighter confirmation |
| Below 15-minute | Lowest | Noise dominates; false breakouts are frequent |
Trading Chart Patterns Effectively
Entry Strategies
Entry on a pattern is a breakout entry. The two standard approaches:
- Entry stop: a buy stop order placed just beyond the pattern boundary, which triggers automatically if the breakout occurs. You get the move without watching the screen, at the cost of being filled on false breakouts too.
- Confirmed close: wait for a close beyond the boundary that satisfies your confirmation filter, then enter. Worse price, higher hit rate.
Neither is superior in the abstract. What matters is that you choose one, write down the filter, and do not switch mid-trade.
Risk Management
A protective stop determines how much capital is at risk before you enter, which is the only point at which you fully control it. Placement conventions:
- Outside the breakout bar, on the opposite side from the breakout direction.
- Beyond the pattern boundary — below support in a double bottom, above resistance in a double top — with a filter added so ordinary noise does not trigger it.
- Never inside the pattern. A stop within the pattern’s own range will be hit by the pattern’s normal oscillation.
Position size follows from the stop distance, not the reverse. Decide the maximum you are willing to lose, measure the distance to your stop, and size accordingly. Widening a stop to accommodate a position you have already taken is the most common way pattern traders turn a planned small loss into an unplanned large one.
Price Targets and Profit Taking
Use the measured move from Table Measured-Move Cheat Sheet as the primary target. Two refinements: check whether a prior support or resistance level sits between entry and target, because price will often stall there; and scale out rather than exiting all at once if the pattern is large enough to justify it. Above all, do not hold an original target once the conditions that generated it have changed.
A practical approach is to identify the pattern on a higher timeframe (e.g., daily) and use a lower timeframe (e.g., 4-hour) to time the entry more precisely, combining the reliability of the higher timeframe signal with the precision of a lower timeframe entry and substantial, sustained moves upon completion.
Chart Patterns vs Candlestick Patterns
Chart patterns and candlestick patterns are often conflated. They operate on different scales and answer different questions.
| Chart patterns | Candlestick patterns | |
|---|---|---|
| Bars required | Many — often weeks to months | One to three |
| Defined by | At least two trendlines bounding price | The relationship of open, high, low and close |
| What it describes | Structure: where price is contained and where it breaks | Momentum at a single point in time |
| Examples | Head and shoulders, triangle, rectangle, cup and handle | Doji, hammer, engulfing, harami, dark cloud cover |
| Typical use | Define the setup, the target and the invalidation level | Time the entry within a setup, or flag exhaustion |
They combine well. A hammer forming at the right shoulder of an inverse head and shoulders is a momentum signal appearing exactly where the structural pattern predicts it should. Steve Nison’s Japanese Candlestick Charting Techniques remains the standard reference for the candlestick side.
Common Chart Pattern Mistakes to Avoid
The primary literature is blunt that the biggest risks in pattern trading are cognitive rather than technical. Four human tendencies do the damage: seeing patterns where there are none; believing market lore without evidence; looking backwards rather than forward; and sticking with original price targets after conditions have changed.
Seeing patterns that are not there
Pattern recognition is a strength that misfires. If you have to adjust a trendline three times to make the shape work, the shape is not there. Test yourself by writing the pattern’s boundaries down before the breakout, not after.
Trading timeframes too short for reliable patterns
Patterns are fractal, so they will appear on a one-minute chart. Reliability is not fractal. Below roughly 15 minutes, noise dominates and false breakouts become the norm.
Ignoring volume confirmation
A breakout without volume expansion is the standard signature of a false breakout. This is the cheapest filter available and the one most often skipped.
Placing stops too close to entry
A stop inside the pattern’s own oscillation range will be hit by ordinary movement. Place it outside the boundary, with a filter, and size the position to suit.
Over-leveraging on pattern confidence
A high-reliability pattern is not a certainty. Even the head and shoulders top, with one of the lowest failure rates of any reversal pattern, fails. Sizing up because a setup looks textbook is how a good pattern produces a bad outcome.
Advanced Pattern Recognition Tools
Automated Pattern Scanning
Scanners detect candidate formations across hundreds of instruments in seconds — useful for surfacing candidates, unreliable for judging them. Scanners have no view on market context and will flag a textbook ascending triangle in the middle of a news-driven collapse. Use them to build a shortlist, then evaluate manually.
AI and Machine Learning
Machine-learning models can classify formations and weight historical outcomes more consistently than a human eye. The constraint is the same as for any backtest: a model trained on one market regime degrades when the regime changes. Treat model output as one input among several, and backtest on your own instruments and timeframes before trusting it.
How We Describe Pattern Reliability
Published “success rates” for chart patterns vary widely because authors define success differently — some measure whether price reaches a measured target, others whether it moves a fixed percentage, others whether the breakout simply holds. Rates also shift with market conditions: the same pattern performs differently in a bull market than in a bear market.
For that reason this guide describes reliability in relative terms — below average, about average, above average, or one of the lowest failure rates — following the classifications in Kirkpatrick and Dahlquist’s Technical Analysis: The Complete Resource for Financial Market Technicians (2nd ed.), rather than quoting single headline percentages. Where we give a figure, we state its source and the definition of success it uses.
Risk warning: no chart pattern predicts price with certainty. Historical pattern performance is not a reliable indicator of future results, and trading CFDs carries a risk of loss.
Pattern Reliability and Market Context
Market Environment
Context changes the odds. Bull markets favour bullish patterns and bear markets favour bearish ones — the trend supplies the follow-through the pattern needs. Range-bound markets favour bilateral patterns and degrade directional ones. High volatility widens both targets and stops, and increases false breakouts.
| Market phase | Characteristics | Patterns that suit it |
|---|---|---|
| Accumulation | Institutional buying, low volume | Bullish reversals, rectangles breaking upward |
| Markup (uptrend) | Higher highs and higher lows | Continuation: flags, pennants, ascending triangles |
| Distribution | Institutional selling, high volume at tops | Bearish reversals: head and shoulders, double and triple tops |
| Markdown (downtrend) | Lower highs and lower lows | Continuation: bear flags, descending triangles |
Improving Your Probability
- Require volume confirmation, calibrated to the pattern type.
- Look for alignment across timeframes — a daily pattern inside a weekly pattern pointing the same way is a stronger case than either alone.
- Trade fewer, higher-quality setups instead of every formation you can find.
- Size positions according to pattern reliability, not conviction.
- Keep a pattern journal. Record every pattern you identify and its outcome. This is the fastest way to build genuine recognition, and it produces your own performance data rather than someone else’s.
Frequently Asked Questions
What is the most reliable chart pattern?
No single pattern is reliable in all conditions. Kirkpatrick and Dahlquist classify the head and shoulders top as having one of the lowest failure rates among reversal patterns, which is why it is widely treated as a benchmark formation. Reliability improves on daily and weekly charts with volume confirmation on the breakout.
How many chart patterns are there?
There is no fixed number. More than 75 chart patterns are used by traders, though most rely on a core group of 10 to 15. This guide covers the 12 that recur most consistently across forex, indices, commodities and equities.
What is the difference between chart patterns and candlestick patterns?
Chart patterns form across many bars — often weeks or months — and are bounded by at least two trendlines. Candlestick patterns form on one to three bars and read the relationship between open, high, low and close. Chart patterns describe structure; candlestick patterns describe momentum at a single moment.
How do you draw a chart pattern correctly?
Connect at least three significant highs or lows rather than two — a three-point trendline is considered more valid. Use the candle body instead of the wick for a more representative touch point, or closing prices on longer-term charts. Draw the boundaries before the breakout, not after, so the pattern is not fitted to an outcome you already know.
Do chart patterns work in cryptocurrency markets?
Yes. Bitcoin, Ethereum and other major cryptocurrencies regularly form textbook continuation and reversal patterns, because the same psychological forces that produce patterns in equities and forex operate in crypto. Triangles and wedges are especially common during consolidation. Higher volatility means patterns can produce more exaggerated moves in both directions, so stops and targets both need to be wider.
Can chart patterns be used for day trading?
Yes, but with tighter discipline. Patterns are fractal and appear on intraday charts, but reliability falls as the timeframe shortens because noise makes up more of each bar. Below roughly 15 minutes, false breakouts become frequent. Day traders working with patterns should require a stricter confirmation filter and accept a lower hit rate than a swing trader on the daily chart.
How long does it take to learn to identify chart patterns?
Most traders need three to six months of consistent practice for pattern recognition to become reliable. The effective route is to start with two or three high-probability patterns — head and shoulders, double top and bottom, and flags — before adding complexity. Working through at least 100 historical charts across different markets builds the foundation for real-time identification. Keep a pattern journal recording every pattern you identify and its outcome; it accelerates the process more than any other single habit.
Is volume confirmation always necessary?
It is the single most useful filter available, and skipping it is the most common cause of avoidable losses on pattern trades. Volume typically contracts as a pattern forms and expands sharply on a valid breakout; a breakout on flat volume is the classic profile of a false breakout. In markets where reliable volume data is not available, such as spot forex, tick volume or a volatility measure can serve as a proxy.
Your Edge in the Market Starts Here
Chart patterns endure because they are rooted in something that does not change: the fear, greed and indecision that drive every market. That is why the same formations appear on an equity chart, a currency pair and a cryptocurrency, and why a framework built in the twentieth century still describes price action today.
An edge, though, comes from the discipline around the pattern rather than the pattern itself. Wait for the breakout that actually completes the formation. Apply a confirmation filter you have written down. Place the stop outside the boundary and size the position to fit it. Take the measured move as a projection rather than a promise, and abandon it when conditions change. Above all, keep the journal — the record of your own patterns and their outcomes is worth more than any published success rate.
Risk warning: trading CFDs carries a significant risk of loss and is not suitable for all investors. Chart patterns do not predict future price movement with certainty, and past performance is not a reliable indicator of future results. This material is for educational purposes only and does not constitute investment advice.